
.png&blockId=36a497bc-e359-4617-8735-3d6cc577866f&width=3600)
By Aileen, Matthew
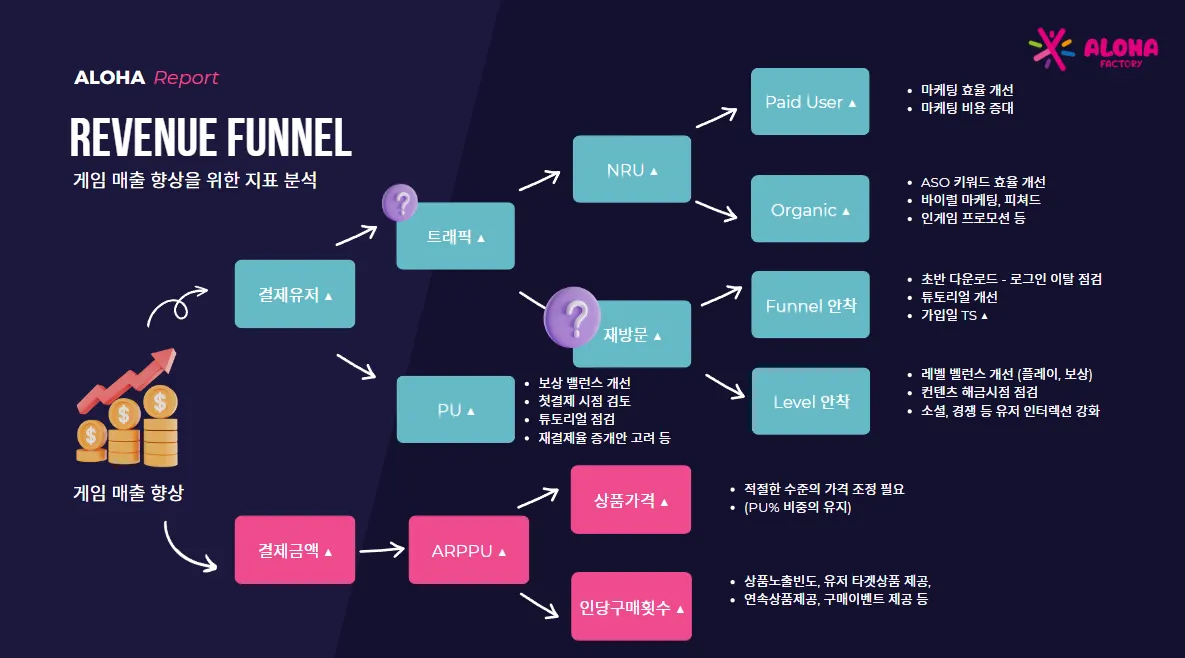
In the previous post, we looked at the user metrics that should be examined to improve game revenue. As explained in the previous post, increasing paying users is the foundation of the Revenue Funnel to improve game revenue, and this requires an increase in traffic as a basic premise. And to improve traffic, a structure that leads to an increase in new user acquisition or retention rate of existing users should be formed. Retention is an essential metric that must be considered not only for games but for all services to be maintained. In this post, we introduce the basic concept of retention and how Aloha Factory utilizes this metric.
Metrics representing user engagement
Retention
Retention is a metric that measures how many users visit the game again after installation. A high retention rate means that users regularly visit and play the game. It is an important metric for measuring not only the retention rate of naturally acquired users, but also the cost-effectiveness of marketing efforts. Without supporting the user's retention level, there may be no revenue metric that exceeds the ratio of the cost of marketing expenses.
Example of calculating retention
Suppose five users use the service for the first time simultaneously on January 1, 2023, and visit as shown below.
User | 1/1 Install (Day 0) | 1/2 (Day 1) | 1/3 (Day 2) | 1/4 (Day 3) | 1/5 (Day 4) |
A |  | | | | |
B | | | | ||
C | | | | ||
D | | ||||
E | |
Two out of five users who visited on January 3 represent 40% retention rate.
Category | 1/1 (Day 0) | 1/2 (Day 1) | 1/3 (Day 2) | 1/4 (Day 3) | 1/5 (Day 4) |
Number of Visiting Users | 5 | 3 | 2 | 2 | 1 |
Retention Rate | 100% | 60% | 40% | 40% | 20% |
Day 1 Retention
Day 1 retention represents the user's data on the D+1 day after the user's first game execution. It means the proportion of users who are re-acquired after the user's inflow and represents the user's initial experience. It can be used as a measure of onboarding to see if players are interested in the game in the early stages.
Day 7 Retention
This is a metric that can determine how many users are remaining in the game after one week of the initial game execution. If D1 retention is a measure of initial experience, D7 retention can be understood as a metric of the number of users who have understood the game system and established themselves. It is important to consistently provide the goals of the players as players at this stage so that they can remain in the game for a long time.
Day 30 Retention
This is a metric for the retention rate one month after the initial game execution. Based on the retention metrics up to this point, a strategy is established to prevent users from leaving and maintain them in the long term.
TIP) The meaning of retention in terms of game potential
Retention is the most important metric for showing the potential of mobile games. If the Day 1 (D1) retention rate is 40% or higher, it can be considered a decent game, and if it is 50% or higher, significant achievement can be expected. (Top revenue games representing a genre achieve up to 60% or more.)
D1 retention is an important metric for verifying initial experience. Therefore, to become a game loved for a long time, D7 and D30 metrics are important. Good games have D7 metrics that are half of D1 and D30 metrics that are half of D7. That is, if D1 is 50%, D7 is at the level of 25%, and D30 is 13%. The sum of the D1~D7~D30 metrics in the example is the number '88', which is also the target game metric that Aloha Factory aims for. (50+25+13=88)
When judging retention, the slope of the retention curve is as important as the D1 metric, and it is being used as a key metric for judging whether the game is launched or not. Aloha Factory estimates the retention curve to estimate future expected revenue and plans to apply it to the 'FLAMINGO' service within this year.
How Aloha Factory uses retention
Aloha Factory sets retention goals sequentially according to the development stage of the game.
During the prototype testing stage, they set the retention goal for day 1 and check if user engagement is good. If the initial day 1 retention is at a certain level, there is room for improvement in subsequent stages of retention, so they focus on user retention in the early stages.
If the initial retention is low, they analyze the funnel from the user's app launch to the completion of the tutorial and early content and identify where the most attrition occurs to improve the tutorial or content, UI, etc.
Aloha Factory also uses session retention to determine the user's condition in the early stages. By measuring retention on a session basis, they can determine if users can enjoy sufficient content in the early stages.
Once day 1 retention is stable, they focus on measuring the 3-day and 7-day retention during the advanced stage to measure if users enjoy the game for a long time and to focus on enhancing the fun.
If you're curious about Aloha Factory's production process, please check out their previous post on how they made the global hit game "Dragon Island"!
In the next post, they will explain how they analyze ARPU and ARPPU to increase game revenue.
Do you want to learn more about easy ways to access and improve data?
Become a partner of Aloha Factory!
Aloha Factory Publishing Guide
Aloha Factory Publishing Guide