
_(4).png&blockId=8e905fbc-d185-43a9-8cc1-a883dc0d3a47&width=3600)
Aloha Factory's game production process is divided into stages: Marketability Test (S1-S2) -> Gameplay and Profitability Test (S3) -> Launching and Scaling Up (S4) -> Operational Stage (S5). Even within this value chain, the game production process is further subdivided. As shown in the process below, we focus on each stage to confirm KPIs, analyze data, and prepare for the next stage. For Aloha Factory's production process case study, please refer to the previous post!
Game Production Process
1.
Implement a game concept prototype for marketability confirmation
2.
Develop a prototype that can show core mechanics and loops in early gameplay
3.
Secure various content for mid-gameplay
4.
Profitability phase
5.
Secure long-term content for continued gameplay
To smoothly carry out these processes, the game data analysis platform developed by Aloha Factory, Flamingo, provides objective data and insights to analyze games in the value chain of game production, marketing, profitability, and operation.
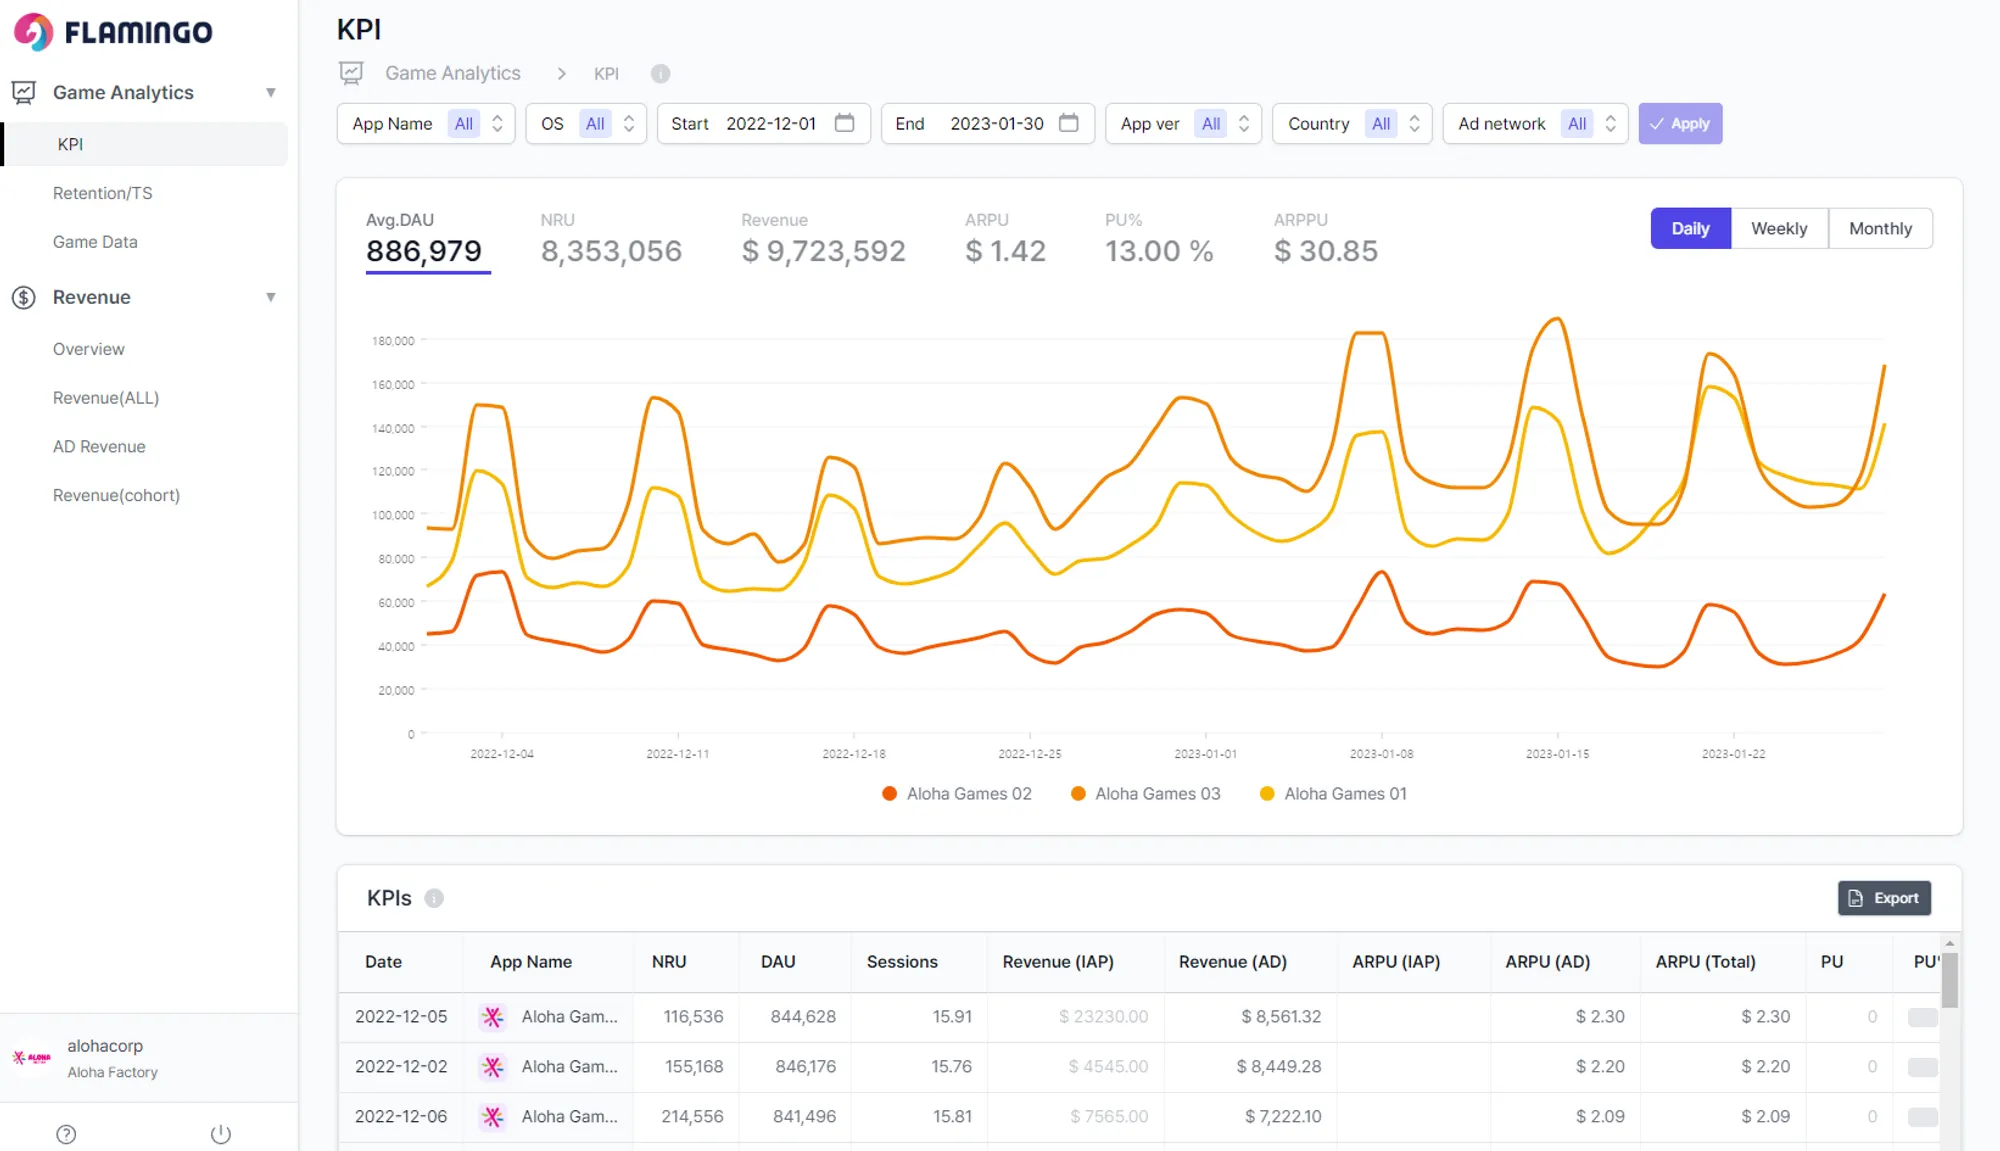
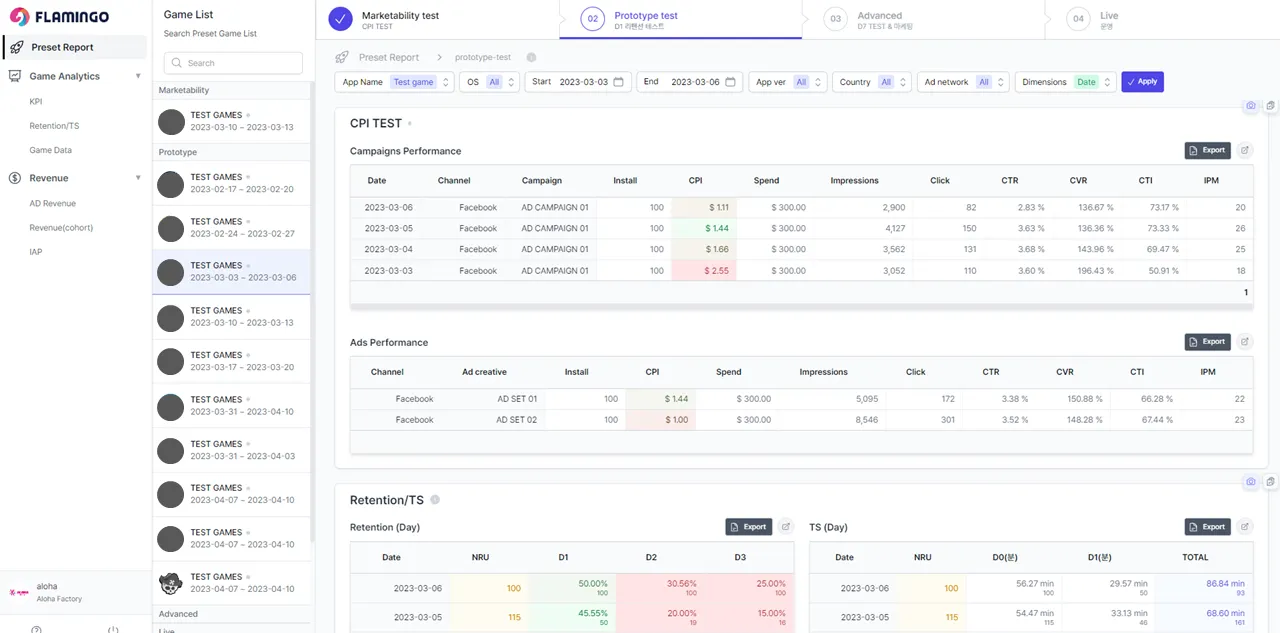
Flamingo's Preset Report
Flamingo provides a preset report that focuses on the necessary indicators according to the game production phase, tailored to Aloha Factory's production process. For example, if our game is in the prototype development phase to confirm the game's early stage success, the most important factors are the funnel in the early stages, including how well users settle in from the tutorial stage to each stage of play, and metrics such as session and day 1 retention.
Rather than providing multiple indicators at once, the Preset Report focuses on checking only the necessary data at each stage and provides insights to improve and increase completeness by comparing the data with that of other games.
1) Data of Marketability Test Stage (S1-S2)
In the marketability test stage, we test how much potential the game concept has in the market and how interesting it is to users in the early stages of production. Therefore, the CPI (Cost Per Install) metric is the most important metric to measure the marketability of the game. We can also check the user's onboarding status, initial stage dropout rates, user activity over time, session-based retention, and TS metrics.
2) Data of Gameplay and Profitability Test Stage (S3)
In the S3 stage, we divide it into three sub-stages to test the game's gameplay and profitability. We first check the gameplay indicators, followed by profitability.
In S3-1, we focus on the early gameplay stage, so we check day 1 retention as the key metric. By checking gameplay indicators such as TS, stage dropout rate, and user segment data, we can determine if there is potential. If there is potential, we proceed to S3-2.
In S3-2, we test the game until the production of in-game growth elements and additional content play volume is completed and sequentially confirm the target indicators for the third day. However, some games earn profits from the beginning, so it is essential to consider the genre, game characteristics, and other factors comprehensively to determine the direction and level of the game's production. In S3-3, we add IAP (In-App Purchases) and IAA (In-App Advertising) products that can confirm profitability to estimate the actual user LTV and determine business feasibility, as in the marketability test stage.
3) Launching and Scaling Up (S4)
The Launching and Scaling Up stage focuses on preparing for the launch and stabilization of the game, expanding content, and improving game completeness through launch. We check day 7 retention data as the key metric and measure LTV until day 7, 14, and 30 after the test to determine the game's sustainability. We then start marketing in earnest, organize target countries into tier groups, and conduct tests to expand major media. After launch, we check ROAS (Return on Ad Spend) and determine to what extent we can strategically scale up, increasing the scale for each country.
4) Operational Stage (S5)
The approach to the Operational Stage can differ depending on the game's nature. For games like the hyper-casual genre with low content update frequency during operation, we focus on operating as UA marketing. We conduct cost-effectiveness activities, monitoring ROI and ROAS by channel and country and adjusting campaigns periodically. For games that require many content updates and continuous operation, we operate UA marketing and profitability data (currency and in-app purchase data) as mentioned above.
Marketing Metrics
 ROAS: ROAS (return on ad spend) refers to the "ad revenue per ad spend" and is the most important key performance indicator (KPI) in mobile marketing. It is a measurement method that allows you to easily see how effective your advertising was and can be used to evaluate the effectiveness of UA campaign strategies after the fact.
ROI: ROI (return on investment) refers to the "profitability of advertising expenses compared to revenue."
ROAS: ROAS (return on ad spend) refers to the "ad revenue per ad spend" and is the most important key performance indicator (KPI) in mobile marketing. It is a measurement method that allows you to easily see how effective your advertising was and can be used to evaluate the effectiveness of UA campaign strategies after the fact.
ROI: ROI (return on investment) refers to the "profitability of advertising expenses compared to revenue."We are optimizing the data according to the lifecycle of the game and focusing on actions that are suitable for each stage to reach the game's goals more quickly.
We are currently opening up the Flamingo service to game developers who are testing through Aloha Partners, so they can use it to test and analyze their results, and we will sequentially update its features.
In addition, we are preparing segmented analysis reports and operational features, and we plan to expand the service to support you until after the service launch. We hope that Flamingo will be of great help to game developers.
Do you want to know more about how to access and improve your data easily?
Become a partner of Aloha Factory!