
_(1).png&blockId=234a9cea-2441-41f6-8b82-d6381dda04eb&width=3600)
By Aileen, Matthew
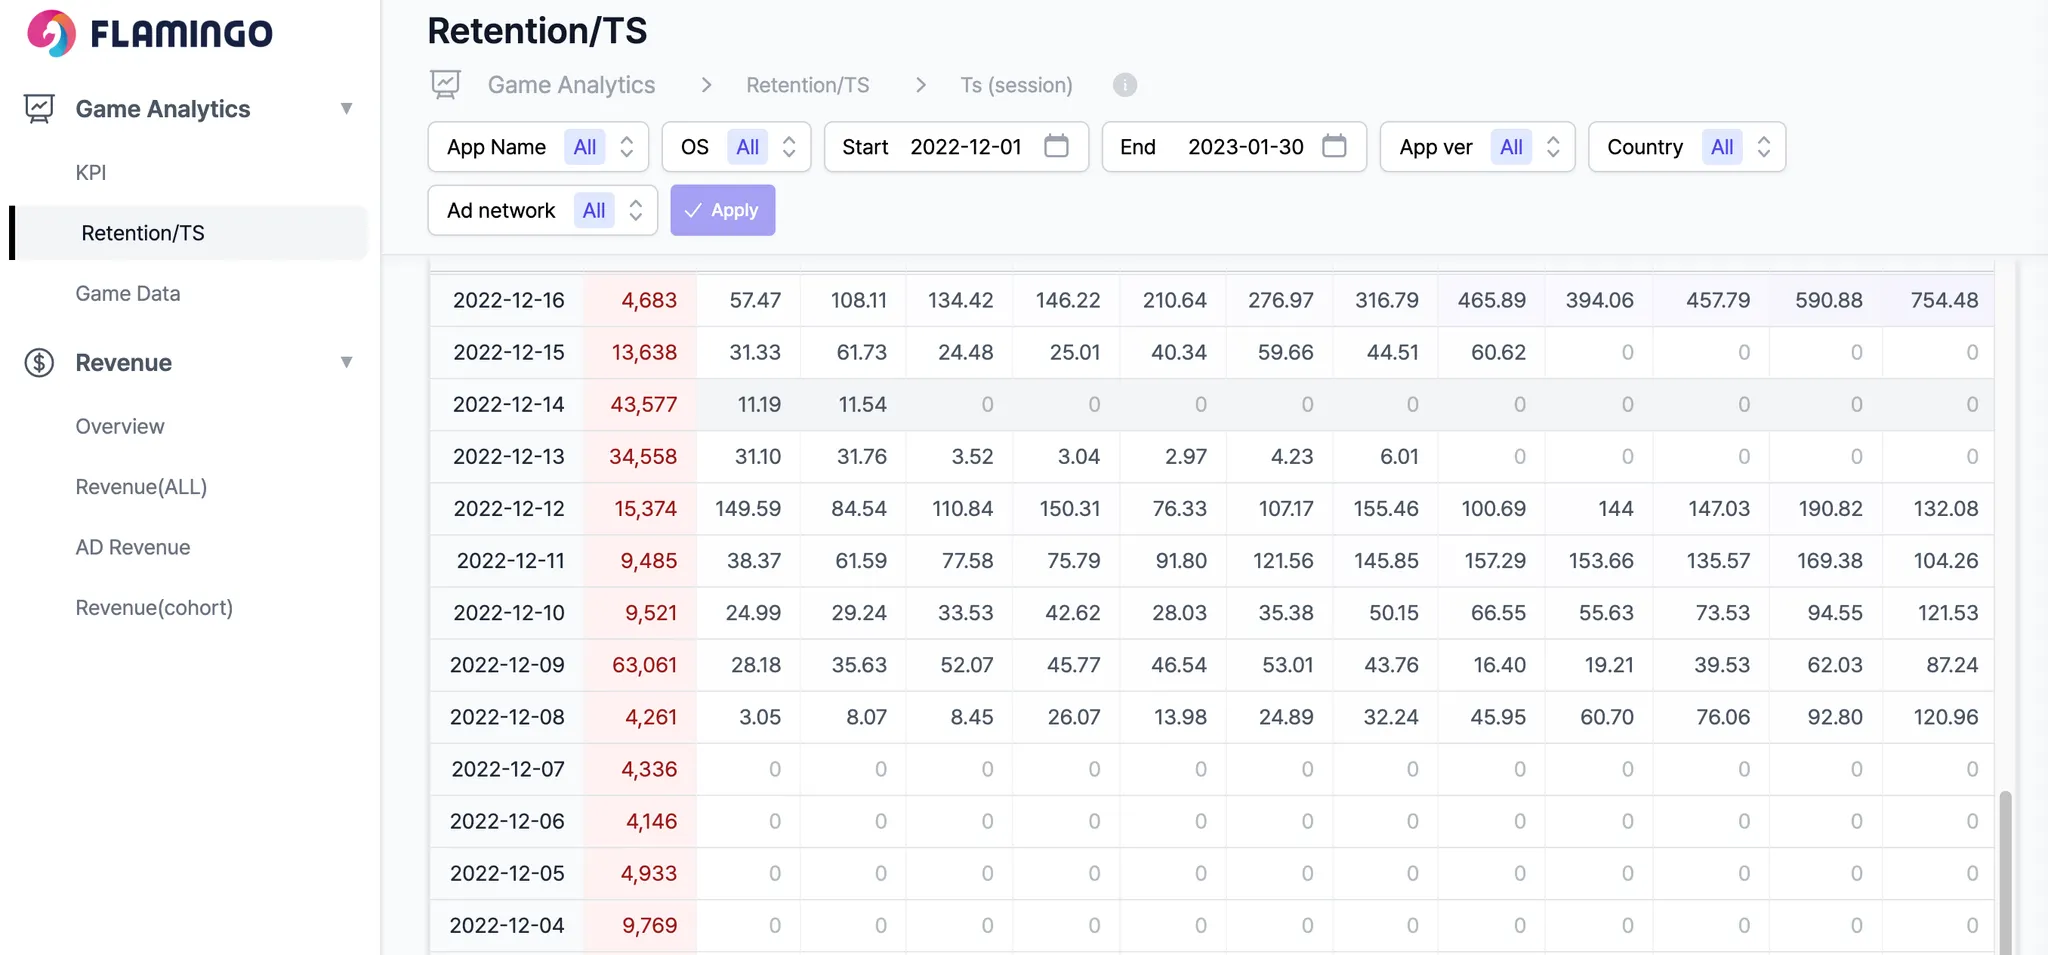
In the last post, we looked at retention indicators that are essential for improving game sales.
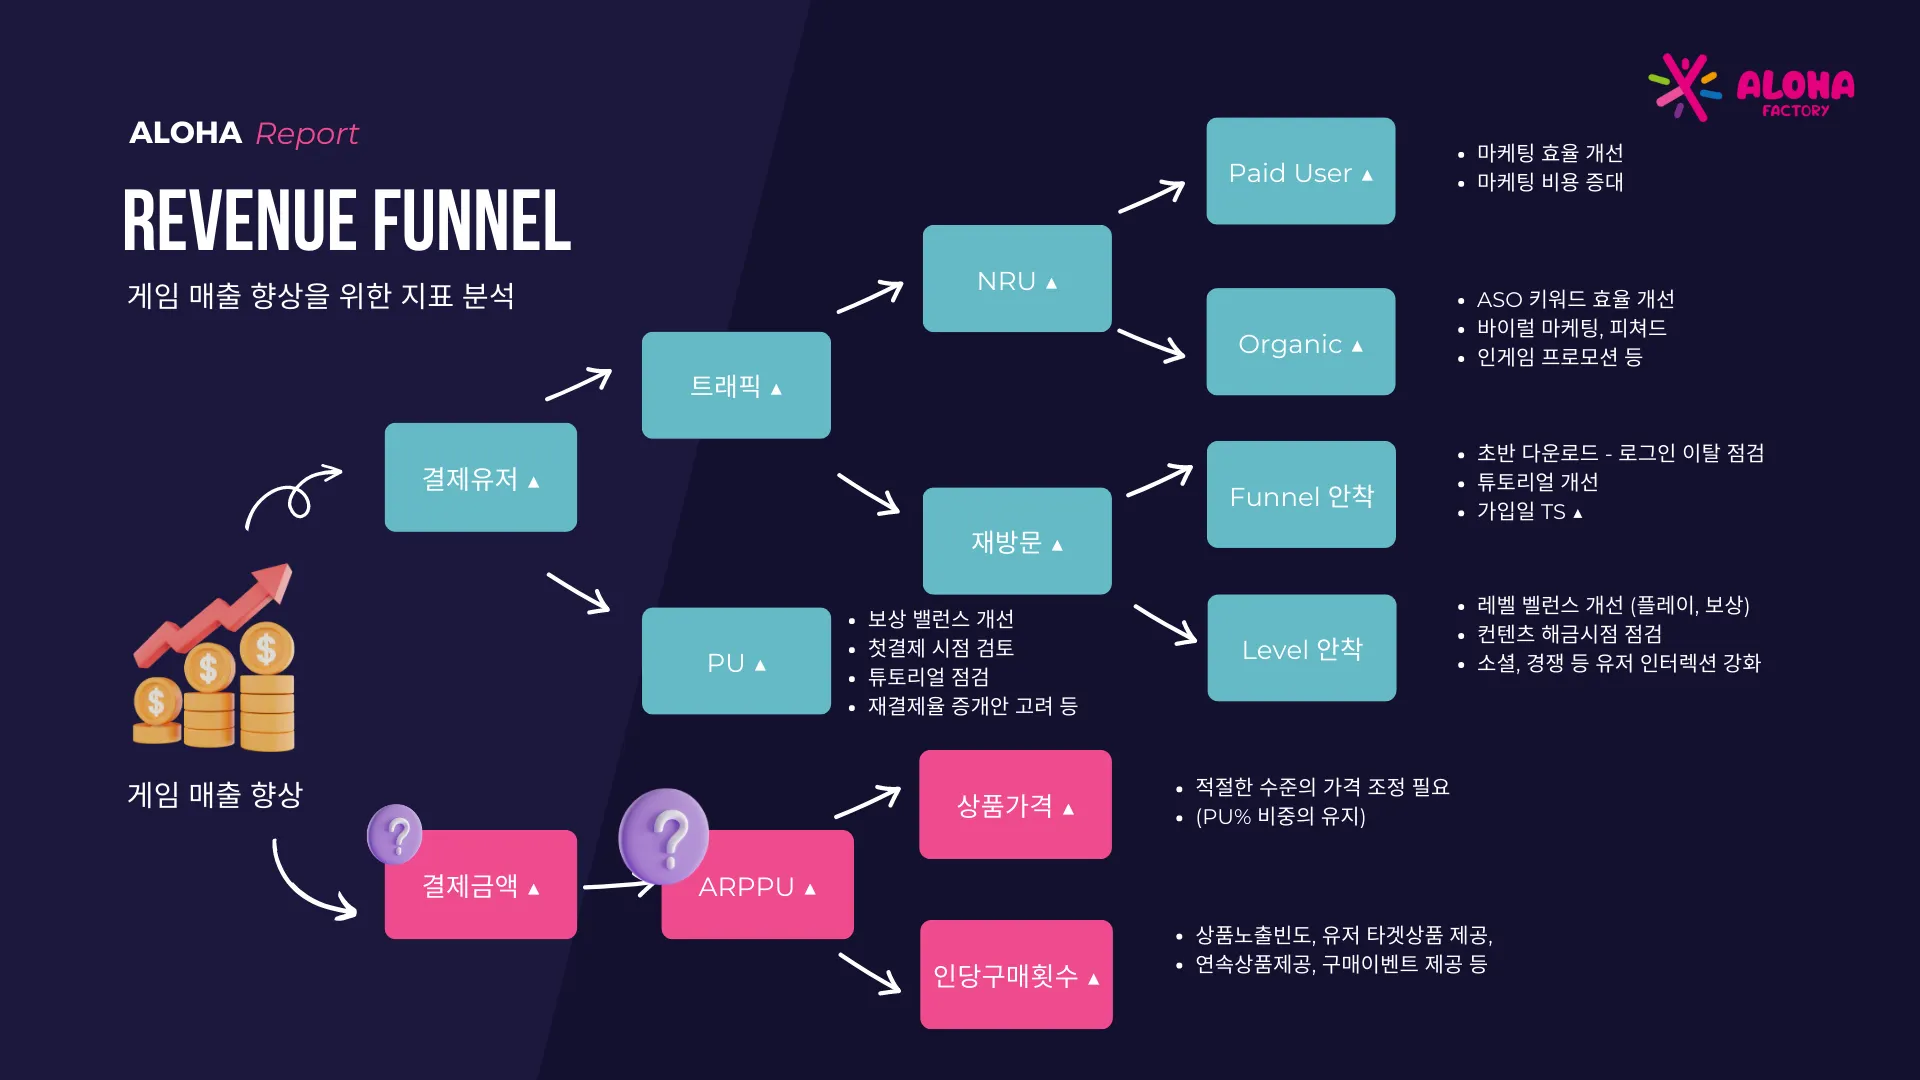
According to the Revenue Funnel, an increase in game sales is based on the basic premise of increasing the number of paying users or increasing the amount of payment. In this post, we introduce the concept of ARPU and ARPPU indicators, which are essential for game sales analysis, and how Aloha Factory uses these indicators.
A metric that measures the revenue efficiency of games: ARPU
ARPU (Average Revenue Per User) is an indicator of average revenue per user, and is the revenue per unit divided by the total number of users. In mobile games, it is mainly used as a case of ARPDAU to check the revenue per active user.
ARPU is used as an important metric in all mobile games because it can determine how much revenue an average user earns over a given period of time. ARPU is usually affected by hardcore games such as RPG games showing higher numbers than light casual games. Casual is a game enjoyed by many users, but is less loyal and pays less than core games, while core games have a high proportion of users who are loyal and pay a lot.
ARPU during a user's life time means LTV (Life Time Value), which plays a key role in designing marketing costs as expected revenue per new user. It is important because it tells you how much revenue the channel that introduced users through UA activities generates and evaluates which channels are providing customers with the highest sales quality.
ARPU varies widely across game genres and across countries. Ad-oriented games, mainly in the US, are around $0.5, but IAP (In App Purchase)-oriented games generate profits from $1 to several tens of dollars.

Life Time Value (LTV) in mobile casual games
Each genre of game has a different LTV, but it is common for games to have similar LTVs within a genre.
This is because it is influenced by the purchasing power of the target user group and the level of content. Therefore, identifying the profitability of games and genres that can serve as references is important in estimating the profitability of games in production.
Above all, LTV is important because it can estimate the potential of a game through comparison with marketing unit price. The CPI (Cost Per Install) ≤ LTV (ROAS ≥ 100%) indicator determines whether a game is launchable or not, and the difference can be viewed as the minimum revenue per user.
Puzzles vary greatly in detail, but the LTV calculation period ranges from 3 to 9 months and is seen at the level of $2 to $3. On the other hand, in the case of the light core genre, look at the LTV for a period of less than one month and look at $2 to $3. However, games with a high probability of success achieve 100% ROAS within 1 week (LTV≥CPI), and ROAS 150-200% within 1 month.
Analyzing ARPU cohorts
Aloha Factory analyzes and checks ARPU on a cohort basis as well as a period unit to measure marketing performance. This represents the revenue indicator generated by new users over a certain period of time, and is a useful indicator for segmenting and measuring the performance of new users in UA activities.
Buying user analytics: ARPPU, PU
ARPPU (Average Revenue Per Paying User) means the average amount of payment per user among users who have made a paid payment.
This refers to users who have paid for purchases such as item purchases or monthly payments within a certain period of time within the app. More recently, it is most often used to measure in-app revenue per user for games that are free to download but use in-app purchases.
Since it is an indicator of how much money a paying user spends on average, a high ARPPU generally has a positive effect on sales growth. However, depending on the direction of the game, it can be seen that the proportion of paying users, which will be explained below, is biased towards existing users only, and whether the payment ratio of new users is maintained steadily.
PU is Paying User or BU; Buying User is expressed as a purchasing user, and represents a user who made a paid payment among users. PU% is the purchasing user ratio, which indicates the ratio of paying users among users who use the game.
Improving PU% is one of the most important tasks for improving the profitability of the game, so you can think about various actions such as improving the in-game reward balance, checking purchase tutorials, providing target products according to user segmentation, and improving FLOW to improve the repayment rate. there is.
What is the PU% (Rate) in the game?*
What level do you think the PU Rate is in the game? If you look at the actual numbers, you will think that the numbers are too low than you think.
The PU rate of a general game is considered to be 2-3% and varies depending on the game, but most of them can be seen within 5%. However, users within this 5% account for more than half of the total sales in games including advertisements, and in the case of RPG games in particular, the top 20% of PU users (i.e., users around 0.5% of the total) account for total sales. It is often seen that the majority of
The core KPIs explained above are the most important KPIs and basic indicators to be monitored. In order to obtain the insights needed to improve our game, find problems in these KPIs, further subdivide them, identify the core needs of users, and enjoy the fun of the game. It is important to add
The core KPIs explained above are the most important KPIs and basic indicators to be monitored. In order to obtain the insights needed to improve our game, find problems in these KPIs, further subdivide them, identify the core needs of users, and enjoy the fun of the game. It is important to add
Become a partner of Aloha Factory!We help you achieve long-term success in the global market by improving key performance indicators (KPIs), from feedback on mobile game production to user engagement and monetization.
https://www.aloha-corp.com/publishing